Today experiment is a .MAP visualizer, for maps created with the Build Engine (Duke Nukem 3D) created by Ken Silverman.
I grew up playing videogames during the 80s and 90s and one of the games that struck me the most in my childhood was Duke Nukem 3D.
Not only for its fun gameplay, amazing technology and postapocaliptic setting, but because the CD included the level editor created by Ken Silverman.
I expend so many hours creating my own maps. You could even edit the ones from the game. I remember taking the first map of the game (E1L1) and adding a whole new building with several floors and elevators. Its a pity that all those maps got lost in time…
This week I decided it should be a beautiful homage to the game to try to visualize a map file using WebGL, as a way no know better the technology behind it.
One of the things I remember when creating my maps (and playing the game) is that maps where created by interconnected top-down sectors (like in Doom). This video shows a nice explanation of how it works.
I searched on the internet for the file format specification for the .MAP files and for my surprise it was extremly easy to parse. Every map contains three arrays, one with sectors, one with walls and one with sprites. Thats all.
It is interesting to see that the map format is very agnostic to the gameplay, it leaves some empty bytes per sector and wall, so the programmer could use them to add the gameplay properties.
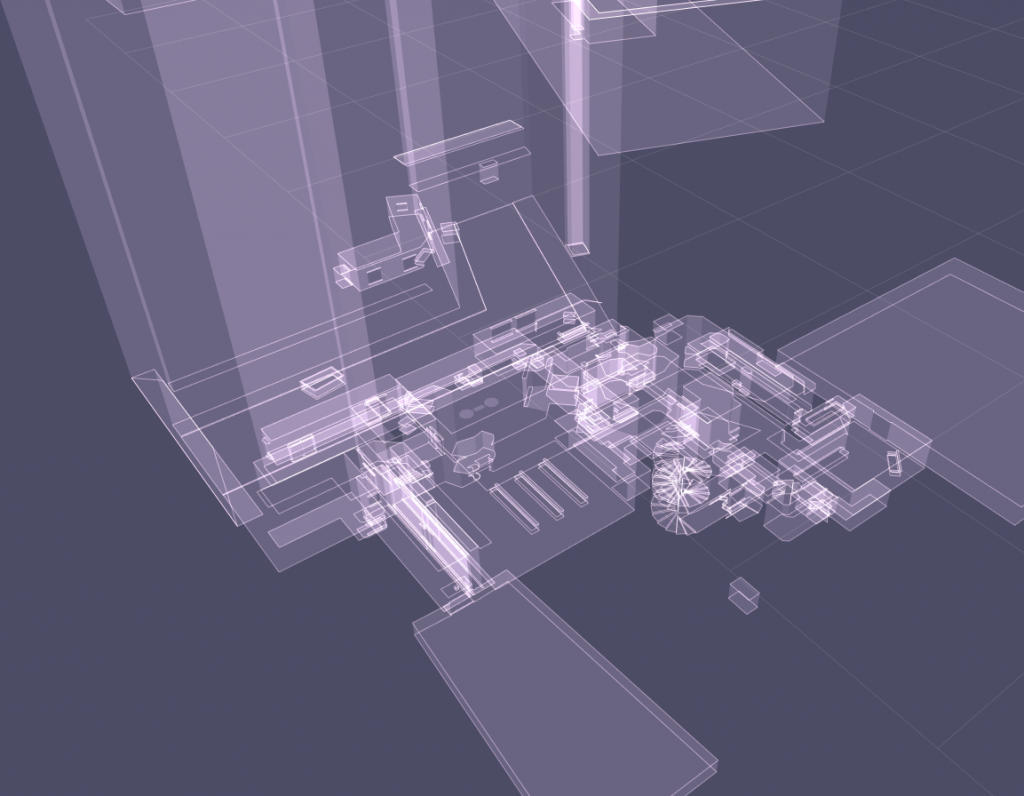
Once I had parsed the info I tryed to create a wireframe to show the contour of every sector. To my surprise that turned to be working quite fast.
The next problem was floors and ceilings. The game allows sectors with holes, and because it doesnt contain the sectors triangulated, it meant I had to do the triangulation by myself.
I sent an email to Ken Silverman to ask for some help and I was delighted with his fast and insightful response. He told me that the map structure contains first the outer wall and afterwars every hole.
With that info a searched for a triangulation algorithm and what was my surprise when I found earcut, a tiny library in javascript that triangulate polygons and support holes! super easy to integrate.
You can test the app here:Â http://tamats.com/apps/build/
I plan to add support for textures soon but that wont be easy, meanwhile, enjoy this holographic look.
Leave a Reply